
Monitoring Road Traffic with Python
Today, one of my colleagues located a nearby traffic camera that monitored a particularly busy road near where we work. This road can make the journey home a real pain in the ass, and it is much easier to just stay in the office and work later until it calms down a bit.
Here is a sample image from the camera:
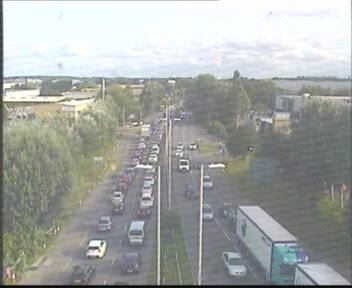
There is a lot of content in this image that is not relevant to the amount of traffic in it. A reasonable first task is to extract the important section of road from the background. The Python library Pillow makes this very easy.
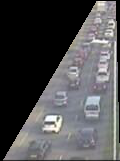
The only fiddly bit is finding the coordinates of the polygon that contains the important section of road.
from PIL import Image, ImageDraw

POLYGON_MASK = [
    (0, 0),
    (0, 288),
    (44, 288),
    (140, 125),
    (160, 125),
    (164, 288),
    (352, 288),
    (352, 0),
]

CROP_RECT = (44, 125, 164, 286)


def process(file_path):
    # Open the file path with PIL.Image
    image = Image.open(file_path)

    # Use PIL.ImageDraw to fill in a black polygon
    ImageDraw.Draw(image).polygon(POLYGON_MASK, fill=(0, 0, 0))

    # Crop the image to get ride of unnecessary pixels
    cropped_image = image.crop(CROP_RECT)

    # Let's look at the result!
    cropped_image.save('output.png')
The result:
The next task is to somehow calculate how much traffic there is in this image. Counting cars is beyond the skill level of this author, but counting pixels is the kind of nasty hack that is right up his street (get it?).
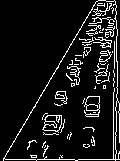
OpenCV provides an excellent edge detection algorithm that outputs a monochrome image with white pixels for identified edges and black pixels otherwise.
from PIL import Image, ImageDraw
import cv2
import numpy

# ...


def process(file_path):
    # Same as last time
    image = Image.open(file_path)
    ImageDraw.Draw(image).polygon(POLYGON_MASK, fill=(0, 0, 0), outline=True)
    cropped_image = image.crop(CROP_RECT)

    # Use numpy to convert the image from PIL format to OpenCV
    opencv_image = cv2.cvtColor(numpy.array(cropped_image), cv2.COLOR_RGB2BGR)

    # Apply the Canny edge detection algorithm
    edged_image = cv2.Canny(opencv_image, 100, 200)

    # Let's look at the result!
    cv2.imwrite('output.png', edged_image)
The result:
A useful metric for traffic would simply be the ratio of white pixels to black pixels.
A slightly better metric would be the ratio of white pixels to pixels that could have been white, remember that some of the pixels from the image were black already from the polygon mask.
from PIL import Image, ImageDraw
import cv2
import numpy

POLYGON_MASK = [
    (0, 0),
    (0, 288),
    (44, 288),
    (140, 125),
    (160, 125),
    (164, 288),
    (352, 288),
    (352, 0),
]

CROP_RECT = (44, 125, 164, 286)


# Count the number of pixels that were not masked by the polygon
# (The result of this function will be constant for all images)
def count_unmasked_pixels(pil_image):
    pixels = pil_image.load()

    count = 0

    for x in range(0, pil_image.size[0]):
        for y in range(0, pil_image.size[1]):
            if pixels[x, y] != (0, 0, 0):
                count = count + 1

    return count


# Count the number of white pixels in the edge image
def count_edge_pixels(opencv_image):
    count = 0

    width, height = opencv_image.shape[:2]

    for x in range(0, width):
        for y in range(0, height):
            if opencv_image[x, y] == 255:
                count = count + 1

    return count


# Stitch together and return the ratio
def calculate_traffic_score(file_path):
    image = Image.open(file_path)
    ImageDraw.Draw(image).polygon(POLYGON_MASK, fill=(0, 0, 0), outline=True)
    cropped_image = image.crop(CROP_RECT)

    unmasked_pixels = count_unmasked_pixels(cropped_image)

    opencv_image = cv2.cvtColor(numpy.array(cropped_image), cv2.COLOR_RGB2BGR)
    edged_image = cv2.Canny(opencv_image, 100, 200)

    edge_pixels = count_edge_pixels(edged_image)

    return float(edge_pixels) / float(unmasked_pixels)
Results
Running this algorithm on the camera near my work gives reasonable results for just a few hours of experimentation.
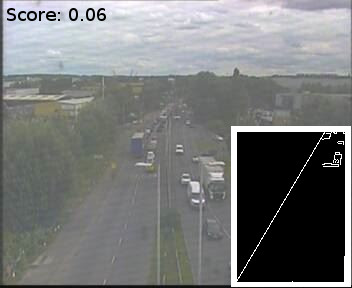
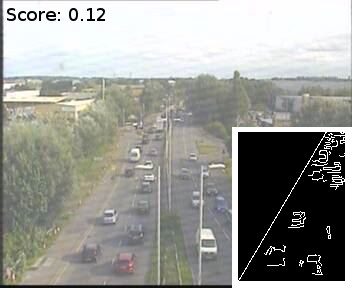
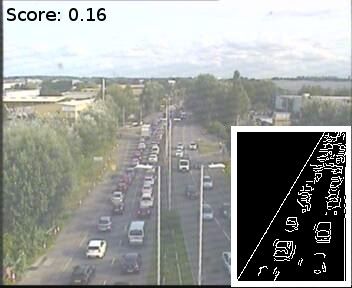
One of the weaknesses of this algorithm is that more edges will be detected in direct sunlight because of the increased contrast. A solution to this would be to use tensorflow or a more intelligent form of processing to actually count the vehicles.